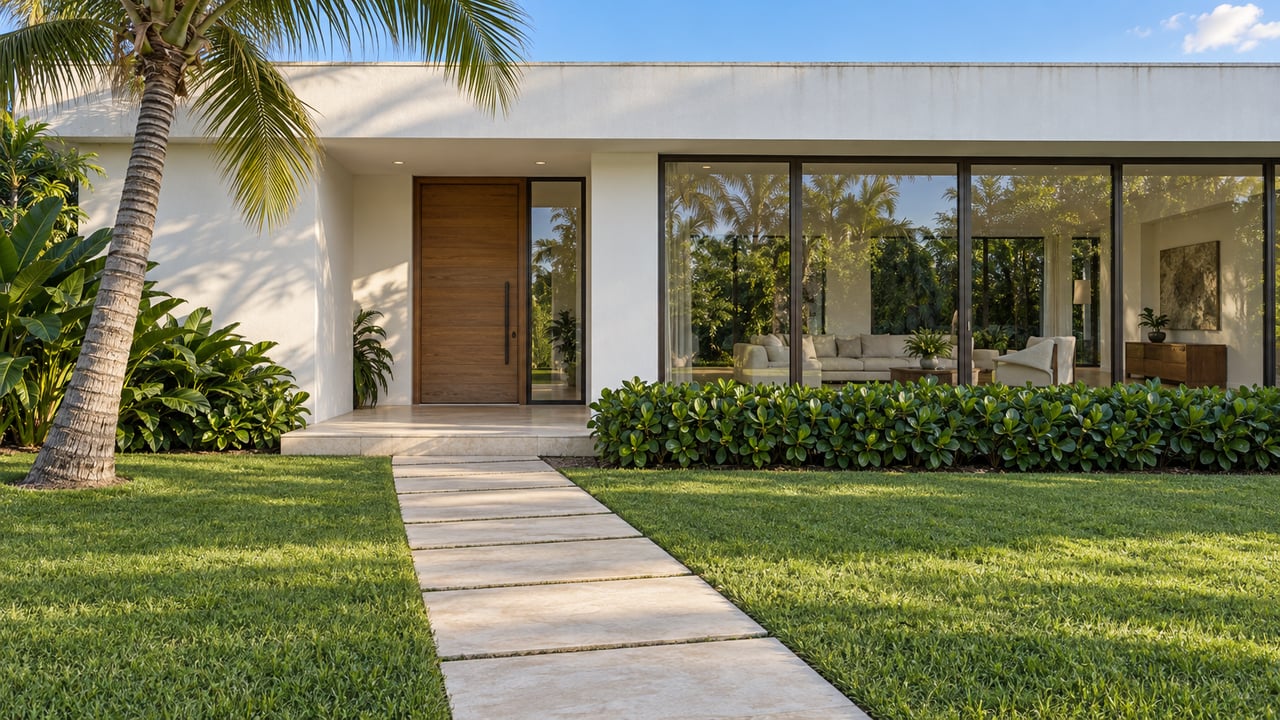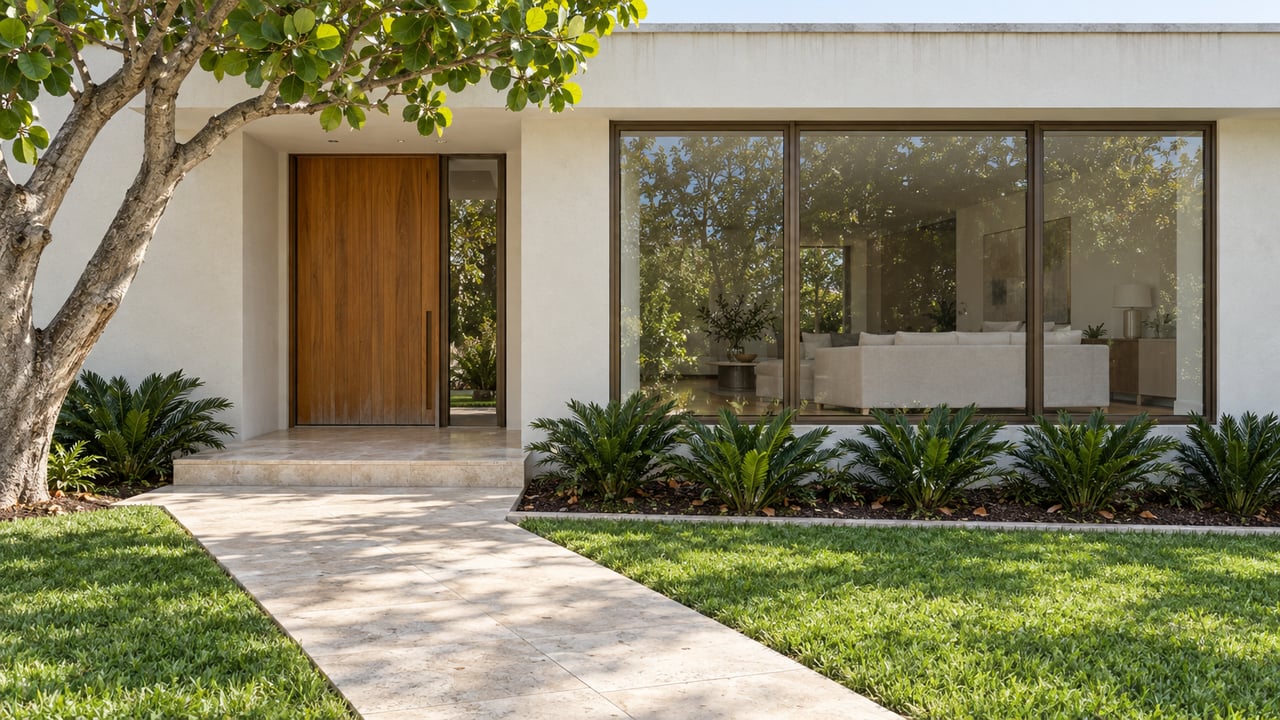
Two homes changed hands on Calusa Street in July 2026, a few weeks apart. At 2777 Calusa, a 765-square-foot house built in 1947 sold for $3.1 million, which works out to $4,052 per square foot. At 2800 Calusa, a 6,393-square-foot house finished in 2025 sold for $8.1 million, or $1,267 per square foot. If you go by the figure on most listing sheets, the cottage cost more than three times as much as the new house.
The two lots tell a different story. The City of Miami's parcel records put 2777 Calusa on 7,500 square feet of land and 2800 Calusa on 10,565. Divide each price by its lot, and the cottage sold for about $413 per square foot of land while the new house sold for about $767. On that measure the order reverses. The buyer at 2777 Calusa paid for a lot that came with a small house on it.
In Coconut Grove, price per square foot means one thing for a house and something else for a condo. Among houses, a high price per interior foot usually points to a small house on its own lot, and frequently to the cheaper land. Among condos, the same figure mostly follows when the building was finished. Anyone comparing the Grove against other neighborhoods with one blended per-foot number is comparing different things.
The Quarter Behind the Numbers
The source is Haute Residence's Q3 2026 Coconut Grove report, built from county deed records. For July 1 through September 30, 2026, it counts 57 recorded residential sales of $2 million or more in ZIP 33133. They totaled $233.9 million, with a median of $3.15 million and a weighted $1,435 per square foot. Forty-one of those sales were single-family homes and 16 were condominiums, with houses accounting for 75 percent of the dollar volume.
That $1,435 combines two kinds of purchase. A Bayshore condo buyer and a Kumquat Avenue house buyer are paying for different things, and in the house sales the land carries most of the price.
Houses, Divided by the Lot
The table lists the Q3 2026 sales of older, smaller houses that recorded the highest prices per interior foot, alongside three newly built houses. The first five columns come from the Haute Residence deed data. Lot sizes come from the City of Miami's parcel records, and the price per lot foot is the sale price divided by that lot size.
| Address | Q3 2026 price | Built | Interior sq ft | Per interior sq ft | Lot sq ft | Per lot sq ft |
|---|---|---|---|---|---|---|
| 2777 Calusa St | $3,100,000 | 1947 | 765 | $4,052 | 7,500 | about $413 |
| 3170 Florida Ave | $3,120,000 | 1944 | 1,088 | $2,868 | 7,150 | about $436 |
| 4152 Battersea Rd | $4,475,000 | 1947 | 1,810 | $2,472 | 19,000 | about $236 |
| 3431 Poinciana Ave | $4,500,000 | 1955 | 2,195 | $2,050 | 13,400 | about $336 |
| 2980 Bird Ave | $2,100,000 | 1922 | 1,064 | $1,974 | 7,500 | about $280 |
| 2490 Abaco Ave | $2,000,000 | 1940 | 1,059 | $1,889 | 6,550 | about $305 |
| 4190 Ingraham Hwy | $6,550,000 | 1935 | 4,622 | $1,417 | 36,620 | about $179 |
| 4040 Kiaora St | $22,500,000 | 2025 | 8,548 | $2,632 | 36,714 | about $613 |
| 4095 Hardie Ave | $5,000,000 | 2025 | 3,874 | $1,291 | 6,398 | about $781 |
| 2800 Calusa St | $8,100,000 | 2025 | 6,393 | $1,267 | 10,565 | about $767 |
Sorted by price per interior foot, the 1947 cottage on Calusa is at the top and the new house on the same street is at the bottom. Sorted by price per lot foot, nearly the reverse happens. The two 2025 houses on ordinary-size lots, 4095 Hardie and 2800 Calusa, cost the most per foot of ground, at roughly $770 to $780. Every older house in the table falls between about $179 and $436 per lot foot.
The new houses on smaller lots sold for more per foot of land because the buyers received both the land and a finished house. The older houses cost less per foot of land because those buyers received the land and an older structure they may keep, restore or replace. On Calusa Street in the third quarter, the gap between $413 and $767 per lot foot is roughly what a completed 2025 house added to each foot of land.
The two large parcels follow the same pattern. 4190 Ingraham Highway, a 1935 house on 36,620 square feet, sold for $6.55 million, about $179 per foot of land and the lowest figure in the table. 4040 Kiaora Street sits on almost exactly the same amount of land, 36,714 square feet. As a newly completed estate, it sold for $22.5 million, or about $613 per lot foot. That was the highest recorded sale of the quarter in the Grove. PROFILEmiami reported that Sabal Development developed the Kiaora house and built it through Sabal Luxury Builder. The city's parcel record puts that lot at about 0.84 acre. On lots of the same size, the two sales are $16 million apart.
Zoning also shows up in this math. 3170 Florida Avenue had the highest price per lot foot of the older houses, about $436. It is in a T4 zone, and a multifamily project called Habitus Florida Ave appears at that address in the City of Miami's waiver log, with decisions dated 2023 and 2024. Land that has been proposed for more than one home behaves differently from a single-family lot a few blocks away.
Condos, Sorted by the Year the Building Opened
A condo buyer is not buying land in the same sense, so price per interior foot is a fair measure for condos. In the Grove's Q3 2026 condo sales, that figure follows the building's completion year closely.
Every sale but one in a building completed in 2016 or later closed between $1,640 and $2,093 per square foot. The two 2024 towers at 2655 South Bayshore Drive and 2678 Tigertail Avenue accounted for five of those sales, at $1,640 to $2,076. Those towers are Mr. C Residences Coconut Grove, which Terra describes as two 21-story towers named Bayshore and Tigertail with 231 residences, completed in 2024. A 2018 building at 2821 South Bayshore Drive recorded the highest condo per-foot figure, $2,093. The quarter's largest condo sale, $9.05 million, was at 2669 South Bayshore Drive in a 2016 building, at $1,697 per foot. A 2020 building at 3581 East Glencoe Street recorded $1,841.
The older buildings fall in a lower range. Two sales at 1 Grove Isle Drive, completed in 1979, closed at $1,186 and $1,142. A 1982 building at 2575 South Bayshore Drive recorded $1,163, and a 1978 property on Via Abitare Way recorded $1,030. The 2001 building at 3400 SW 27th Avenue was in between, at $1,469 and $1,656. The exception among the newer buildings was a 2019 property at 2955 Shipping Avenue, a five-bedroom, 3,450-square-foot residence that sold at $1,043 per foot. At that size, the unit itself appears to have mattered as much as the building's age.
The roughly $500 to $900 per foot between a 1979 Grove Isle unit and a 2024 Mr. C unit reflects the building: its age, its brand and what each of those costs to own. With a house, the same kind of gap usually reflects the lot.
How Fast Each Market Moves
The two markets also move at different speeds. For the 12 months ending November 15, 2026, MLS figures for Coconut Grove show about 4.3 months of supply for single-family houses, with a median of 41 days on market. Condos showed about 8.0 months of supply and 68 days. A condo buyer usually has several comparable units on the market in the same building or one of the same age. A house buyer has fewer homes to choose from, and the lot is what the closest comparable sales share.
Asking prices are also being compared on the blended figure. On October 14, 2026, Coconut Grove had 33 active listings at $2 million or more, with a median asking price of $4.35 million and a combined ask of $1,561 per square foot. Seventeen of the 33 were condominiums. Like the $1,435 sold figure, that per-foot number averages houses, where the price mainly reflects the land, with condos, where it mainly reflects the building.
Running Both Numbers on a Grove Listing
For a house, start with the lot. Look up the parcel's land area in the city's records, divide the asking price by it, and compare the result with recent sales nearby that are similar in size and age. In this quarter's data, an older house on a typical lot fell between about $280 and $436 per lot foot. A finished new house on a similar lot sold for close to $780. A listing priced between those two ranges has to justify its position with its house, its lot or its zoning. Our Coconut Grove neighborhood page has more on the streets where those lots are.
For a condo, compare per-foot prices within the same group of buildings. A 1982 building and a 2024 tower can both be on South Bayshore Drive and still sell hundreds of dollars per foot apart for reasons that have nothing to do with the view. Small samples also make any single number unreliable. We made the same point about medians in Cocoplum's market reports, and with 41 house sales in a quarter, the Grove's figures need the same care.
If you are weighing an older Grove house against a new build, or a recent tower against an older building, the Casanova Group can put the lot-level and building-level comparables together for the specific streets and buildings you are considering. Request a private consultation, and we will start with the parcels rather than the per-foot number on the listing.